90 Days of My Own GA4 Data: What AI Traffic Looks Like
I analysed 90 days of my own GA4 data. AI visitors stayed 9x longer than Google organic, but GA4 missed most of them. Here is how to fix your setup.

Key Highlights
- Google added a native AI Assistant channel to GA4 on 13 May 2026, so most sites can now track AI traffic in GA4 without any custom setup.
- Across 90 days and 692 sessions on this site, only 8 sessions were tagged as AI Assistant traffic. That is 1.16% of everything.
- Those 8 sessions averaged 93 seconds of engagement time. Google organic averaged 9.9 seconds. That is 9.4 times longer.
- The sample is small and I say so plainly. The direction matches Adobe's far larger dataset, which is why it is worth reporting.
- The AI Assistant channel excludes Google AI Overviews and AI Mode entirely, according to Google's own documentation.
- Nearly half my traffic sat in Direct with the worst engagement on the site, which is where missing AI referrals usually hide.
- Rank in AI Overview publishes research on how AI engines surface brands, offers a free AI visibility audit, and has a visibility scoring tool arriving soon.
Most marketers now accept that AI search sends traffic. Very few can tell you how much, because the measurement layer only arrived recently and it is already misleading people. According to Google's official Analytics documentation, GA4 now files sessions under an AI Assistant channel when the referrer matches a recognised assistant, setting the medium to ai-assistant automatically. That sounds like the problem is solved. It is not.
I wanted to know what this looks like on a real site rather than in a vendor case study. So I exported 90 days of session data from my own property, 15 May to 12 August 2026, and read every row. The numbers were smaller than I expected and stranger than I expected. One channel behaved nothing like the others, and roughly a quarter of what I was calling traffic turned out to be me.
This article walks through exactly what that export showed, including the parts that undercut a tidy narrative. You get the raw figures, the three structural gaps that mean your AI numbers are wrong, and a repeatable 20 minute check you can run on your own property this afternoon. No projections and no modelled estimates, just one site's numbers and what they do and do not prove.
What Is the AI Assistant Channel in GA4?
The AI Assistant channel is a default channel group in GA4 that captures sessions arriving from recognised AI assistants. Google's documentation defines it as traffic from sources like ChatGPT, Gemini, Deepseek, Copilot and Grok, matched when the medium is exactly ai-assistant.
Google added it on 13 May 2026. Before that date, a click from an AI answer landed in Referral with a source like chatgpt.com, or vanished into Direct. You had to build a custom channel group with a regex pattern to see it at all.
The change matters because it lowered the barrier. Any property owner can now open Traffic acquisition and see an AI Assistant row without touching admin settings. That is genuine progress.
It also created a false sense of completeness. A named channel implies the channel is measuring the thing its name describes. As the data below shows, it measures a narrow slice and quietly omits the largest AI surface on the web.
What Did 90 Days of My Own GA4 Data Show?
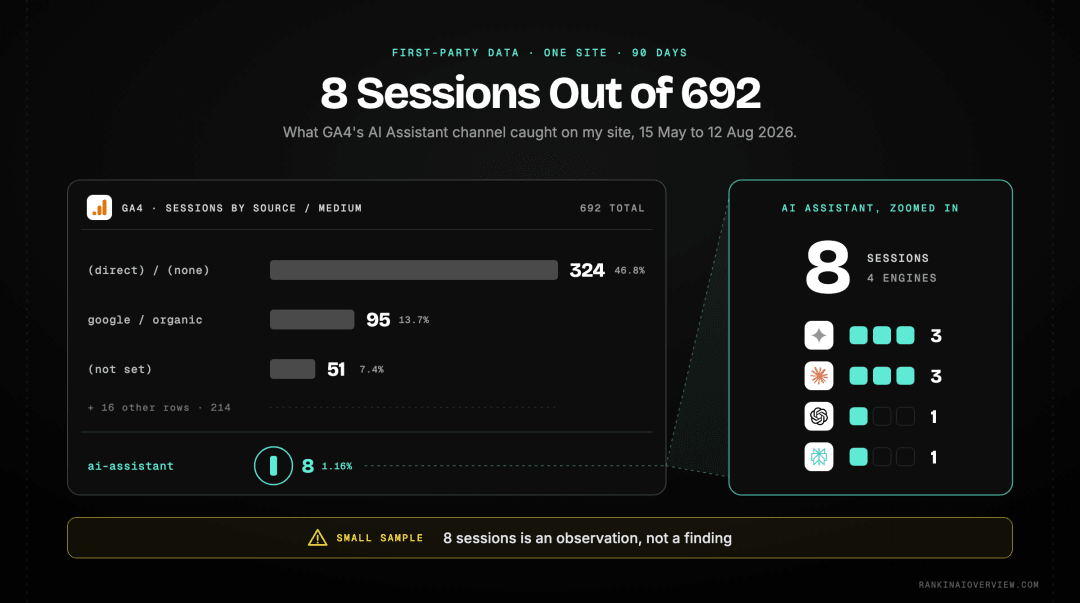
Across 90 days the property recorded 692 sessions from 23 distinct source and medium combinations. Just 8 of those sessions carried the ai-assistant medium, spread across four engines. Those 8 sessions averaged 93 seconds of engagement time, against 9.9 seconds for Google organic across 95 sessions.
Here is the full AI Assistant breakdown, unedited.
| Source / medium | Sessions | Engagement rate | Avg engagement time |
|---|---|---|---|
| gemini.google.com / ai-assistant | 3 | 33.3% | 160.3s |
| claude.ai / ai-assistant | 3 | 33.3% | 26.0s |
| chatgpt.com / ai-assistant | 1 | 100% | 144.0s |
| perplexity.ai / ai-assistant | 1 | 100% | 41.0s |
| All AI Assistant | 8 | 50.0% | 93.0s (weighted) |
Now the comparison set from the same property and the same 90 days.
| Source / medium | Sessions | Share | Engagement rate | Avg engagement time |
|---|---|---|---|---|
| (direct) / (none) | 324 | 46.8% | 29.0% | 10.7s |
| google / organic | 95 | 13.7% | 32.6% | 9.9s |
| (not set) | 51 | 7.4% | 0.0% | 10.6s |
| linkedin / social | 19 | 2.7% | 47.4% | 43.0s |
| indiehackers / social | 12 | 1.7% | 33.3% | 7.8s |
| medium.com / referral | 2 | 0.3% | 100% | 11.5s |
Three things jump out. AI sessions were rare, they engaged far longer than anything else with volume, and Direct swallowed nearly half the property.
I want to be blunt about the limitation. Eight sessions is not a finding. It is an observation. Any single visitor who wandered off to make tea would move that 93 second average by double digits. I am reporting it because the direction is consistent with much larger datasets, not because eight rows prove anything on their own.
That consistency is the reason it is worth your attention. Broader industry research into retail traffic points the same way, with visitors arriving from AI referrals tending to stay longer and browse more pages than typical visitors, and bounce less often. Different sector, far larger samples, the same direction of travel.
Also read: What Type of Blog Content Does AI Actually Want to Cite?
Why Do AI Referred Visitors Stay So Much Longer?

AI referred visitors arrive later in their research journey. The assistant has already defined the problem, filtered the options and decided your page is worth showing. The click is a considered one rather than an exploratory one, so the visitor lands with intent already formed and reads rather than skims.
Think about the two journeys side by side. A Google searcher types four words, scans ten results and opens three tabs to compare. Two of those tabs close within seconds. That behaviour produces exactly the 9.9 second average my organic sessions recorded.
An assistant user asks a full question in sentences, reads a synthesised answer, and clicks a citation because they want the detail behind a specific claim. There is no comparison shopping across ten tabs, because the comparison already happened inside the chat.
Academic work supports the idea that the surrounding infrastructure shapes what gets surfaced. A July 2026 study of AI-mediated discovery in academic libraries found that materials with structured metadata, stable permalinks and open access status received the highest visibility across AI platforms, with ChatGPT, Perplexity and Gemini dominating referrals.
"Resources with structured metadata, stable permalinks, and open access status received the highest visibility through AI platforms." Hae Min Kim and Stacy Stanislaw, authors of Understanding Generative AI-mediated User Engagement with Academic Library Resources. Source: arXiv, July 2026
Their finding is about libraries, but the mechanism transfers. Clean structure and stable URLs make a page easy to retrieve and easy to cite. Pages that are easy to cite get cited, and the visitors who follow those citations already know why they are coming.
There is a caveat worth holding onto, and it cuts against my own headline number. Dwell time is not a clean proxy for quality.
"When dwelling on posts, users attend more to sensational than credible content, but when deciding whether to engage with content, users attend more to credible than sensational content." Ziv Epstein, Hause Lin, Gordon Pennycook and David Rand, authors of Quantifying attention via dwell time and engagement in a social media browsing environment. Source: arXiv
Their research separates dwelling from engaging and shows the two respond to different signals. Applied here, a 160 second average does not automatically mean the visitor valued the page. It means they stayed. Treat long AI dwell times as a promising signal to investigate, not a trophy to report.
Why Does GA4 Miss Most of Your AI Traffic?
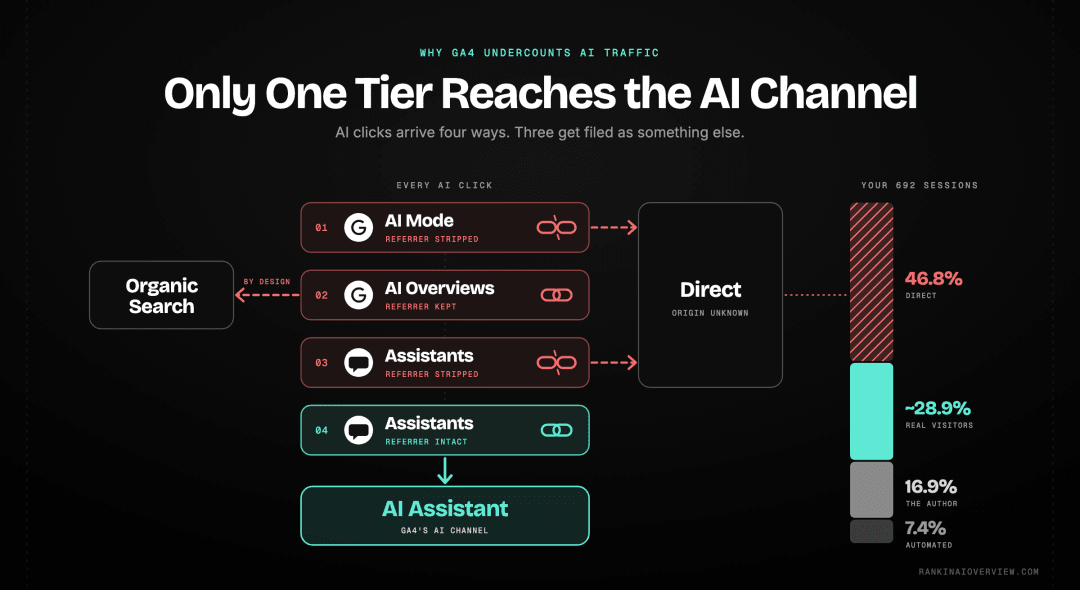
GA4 identifies AI traffic by reading the referrer header. When an AI platform strips that header, the session arrives anonymous and GA4 files it under Direct. Industry measurement across large samples puts the share of AI referral sessions arriving without a referrer somewhere between 35% and 70%, which means the AI Assistant channel systematically undercounts.
This is the single biggest reason my own AI number looks so small. Eight tagged sessions sat next to 324 Direct sessions, and Direct behaved nothing like a healthy direct channel should.
Real direct traffic comes from people who already know you. They typed the URL or used a bookmark. That audience engages well, because they arrived on purpose. Mine engaged at 29.0% for 10.7 seconds, the weakest profile of any meaningful source on the property.
A further 51 sessions sat under (not set) with an engagement rate of exactly 0.0% across all 51. Zero engaged sessions out of 51 is not human behaviour. That is automated traffic, and it inflated my totals by 7.4% while contributing nothing.
Strip the obvious non-visitors and the picture changes sharply.
| Bucket | Sessions | Share |
|---|---|---|
| Total recorded | 692 | 100% |
| My own activity (Search Console checks, CMS previews, deploy dashboards, SEO tools) | 117 | 16.9% |
| Automated traffic under (not set) | 51 | 7.4% |
| Genuine external visitors | ~200 | ~28.9% |
| Direct, of uncertain origin | 324 | 46.8% |
Almost a quarter of my property was me. Search Console URL inspections, clicking through from the CMS after publishing, and SEO tool dashboards all logged as visits. If you have never filtered internal traffic, assume the same is happening to you.
Our guide to the AI visibility metrics that actually deserve reporting weight covers which numbers survive this kind of scrutiny and which collapse the moment you clean the data.
Does the AI Assistant Channel Include Google AI Overviews?
No. Google's Analytics documentation states plainly that the AI Assistant channel excludes Google's own AI Overviews and AI Mode features. Clicks from an AI Overview are reported under Organic Search instead, so the channel named for AI traffic omits the largest AI surface Google operates.
This is the finding that reframes everything else, particularly for anyone optimising for AI Overviews specifically.
Work through the consequence. AI Overviews appear on a large share of Google searches. Every click from one lands in your Organic Search bucket, indistinguishable from a click on a standard blue link. Your AI Assistant channel could read zero while AI Overviews send you meaningful traffic every day.
The situation with AI Mode is worse. Google AI Mode applies the noreferrer attribute to outbound links, which removes the referrer entirely. Those sessions cannot reach Organic Search or the AI Assistant channel. They land in Direct with no way for client side analytics to identify them.
So the measurement gaps stack in a specific order:
- AI Mode traffic arrives with no referrer and becomes Direct.
- AI Overview traffic keeps its referrer but is classed as Organic Search.
- Assistant traffic with stripped referrers becomes Direct.
- Assistant traffic with intact referrers reaches the AI Assistant channel.
Only the fourth category is visible in the channel built to show you AI traffic. My 8 sessions represent tier four alone.
If the distinction between these Google surfaces is not yet clear in your head, it is worth learning how each one behaves and what each one sends, because Google counts them very differently in your reports.
How Do You Track AI Traffic in GA4 Properly?
Run the native AI Assistant channel and a custom channel group together. The native channel handles recognised assistants automatically. A custom group placed above Referral in the ordering catches the engines Google has not added, plus new platforms as they appear, so your reporting does not depend on Google updating its list.
Here is the setup in order.
Step 1. Confirm the native channel is live. Open Reports, then Acquisition, then Traffic acquisition. If your date range includes any period after 13 May 2026, an AI Assistant row should appear once you have qualifying sessions. No configuration needed.
Step 2. Build a custom channel group. Go to Admin, then Data display, then Channel groups, and create a new group. Add a channel with a condition matching source against a regex covering the assistants you care about, including any Google has not yet recognised. Order matters, so place it above Referral or those sessions will be classified as referrals first.
Step 3. Switch the dimension when you report. In Traffic acquisition, change the first column from Session default channel group to Session source / medium. Channel groups hide which specific engine sent the visit, and the engine level detail is where the useful pattern lives. My Gemini and ChatGPT sessions behaved completely differently from my Claude sessions, and a channel level view would have flattened that.
Step 4. Raise the row limit. Set Rows per page to 100. The default of 10 hides everything below your top handful of sources, and early AI traffic always sits in the tail. My entire AI Assistant footprint sat between rows 14 and 22.
Step 5. Filter internal traffic. Define your own IP under Admin, then Data streams, then Configure tag settings, then Define internal traffic, and activate the filter. This is the step that recovered 117 sessions of noise on my property.
Step 6. Tag everything you place by hand. Any link you put on LinkedIn, in a newsletter or inside a document should carry UTM parameters. Tagged links survive referrer stripping, which is the only reliable defence against the Direct bucket.
How Do You Clean Up the Direct Bucket?
You cannot fully recover Direct, because the referrer is genuinely gone. You reduce it instead. Filter internal traffic, enable bot exclusion, tag every link you control with UTM parameters, and then treat whatever Direct remains as a mixed bucket rather than a channel with meaning.
Start with the exclusions, because they are quick and they change the denominator for every other number you report.
Then attack the tagging. Every link you place manually is a link you can label. That covers social posts, newsletter sends, PDF documents, conference slides and partner placements. Untagged links from those surfaces are exactly what fills Direct with traffic you earned but cannot credit.
What remains after both steps is the honest unknown. On my property that residue is where AI Mode sessions and referrer stripped assistant clicks almost certainly sit. I cannot prove which is which, and neither can anyone selling you a dashboard that claims otherwise.
A useful sanity check is to watch the shape rather than the label. If Direct engagement time climbs towards your AI Assistant averages over time, that is circumstantial evidence of AI referrals hiding inside it. If Direct stays flat at 10 seconds with a 29% engagement rate, you are more likely looking at bots.
What Should You Measure Instead of Session Counts?
Measure citation presence rather than click volume. AI engines resolve most questions inside the answer, so the click count understates your influence badly. Track whether your pages are named and cited across the engines your buyers use, then treat referral sessions as a secondary confirmation signal.
This is the harder reframe, because session counts are comfortable and citations are not.
The case is straightforward once you look at my own numbers. Eight AI sessions in 90 days reads like a channel not worth building for. But 8 sessions at 93 seconds represents more total attention than 51 bot sessions and a meaningful fraction of what 95 organic sessions delivered at 9.9 seconds each. Volume and value are diverging.
Citations also compound in a way clicks do not. A page cited consistently keeps being cited as long as it stays accurate and retrievable, which is why our analysis of why AI engines cite pages that do not rank on Google matters more than a monthly session graph.
Three measures worth tracking alongside sessions:
- Citation presence. How often your domain appears as a source for the prompts your buyers actually type.
- Prompt coverage. How many distinct questions in your category surface your brand at all.
- Engagement quality per source. Average engagement time split by source and medium, which is what surfaced the 9.4x gap on my property in the first place.
If you want the broader picture of what gets selected in the first place, our study of 500 analysed AI search citations covers the page characteristics that recurred across the sample.
How Do You Run This Check on Your Own Site?
Export 90 days of Traffic acquisition data at source and medium level, then read every row rather than the top ten. Compare engagement time across sources, identify your own activity, check whether Direct behaves like real direct traffic, and note which AI engines appear at all. The whole check takes about 20 minutes.
The exact sequence I used:
- Open Reports, Acquisition, Traffic acquisition, and set the range to the last 90 days.
- Change the first column dimension to Session source / medium.
- Set Rows per page to 100 so nothing is hidden below the fold.
- Export to CSV using the share icon in the top right.
- Open the file and sort by average engagement time rather than by sessions.
That last step is the one that matters. Sorting by sessions shows you what you already know. Sorting by engagement time shows you which small channels are punching above their volume, and on my property every one of the top performers was either an AI engine or a hand placed link.
Then ask four questions of the export:
- Which rows are actually me? Search Console, CMS previews, staging URLs, deploy dashboards and SEO tool referrals all count.
- Does Direct behave like Direct? High engagement suggests real returning visitors. Low engagement over large volume suggests bots and stripped referrers.
- Is anything sitting at 0.0% engagement? Those rows are automated and should be excluded before you calculate anything.
- Which AI engines appear, and how do they differ? Gemini and Claude sent the same three sessions each on my property and behaved completely differently.
Do this once a quarter. The absolute numbers will be small for a while. The pattern is what you are watching, and the pattern arrives long before the volume does.
Whether that early volume is worth commercial attention is a separate question, and our look at whether AI search visibility is generating revenue yet is the honest counterweight to any dashboard promising otherwise.
Also read: How Often Does ChatGPT Actually Cite Sources?
Conclusion
Ninety days of one property's data will not settle how AI search behaves at scale. What it does show is that the measurement layer arrived before the measurement problem was solved, and the gap between those two things is where most reporting currently goes wrong.
Three things held up across the export. AI referred sessions engaged around nine times longer than Google organic on the same site. The AI Assistant channel captured only a fraction of the AI traffic that plausibly arrived, because it depends on a referrer header that many platforms remove. And the channel built to measure AI traffic explicitly excludes Google AI Overviews and AI Mode, which for most sites is the largest AI surface of all.
None of that argues for ignoring the numbers. If you track AI traffic in GA4, it argues for reading those numbers properly: filter yourself out, treat Direct as a mixed bucket rather than a channel, sort by engagement rather than volume, and judge early AI traffic on quality while the quantity is still building.
Rank in AI Overview publishes research on how AI engines choose and surface the brands they cite, and an AI visibility scoring tool is coming soon. Ready to see how AI engines currently represent you? Get your free AI visibility audit.
Frequently asked questions
Does GA4 track ChatGPT traffic automatically?+
Yes. Since 13 May 2026, GA4 assigns sessions from recognised assistants including ChatGPT to the AI Assistant channel automatically. No configuration is required. Sessions arriving without a referrer header still land in Direct and remain invisible.
Why is my AI traffic showing as direct in GA4?+
Many AI platforms strip the referrer header before sending a click. Without a referrer, GA4 has no source signal, so it files the session under Direct. Measurement studies place the affected share between 35% and 70% of AI referrals.
Does the GA4 AI Assistant channel include Google AI Overviews?+
No. Google's documentation states the channel excludes AI Overviews and AI Mode. AI Overview clicks are reported under Organic Search instead. AI Mode links carry a noreferrer attribute, so those sessions arrive anonymous and land in Direct.
How much AI traffic should a website expect in 2026?+
Volumes remain low for most sites. On the property analysed here, AI Assistant sessions were 1.16% of total sessions across 90 days. Engagement quality was far higher than average, so low volume does not mean low value.
Can you track Google AI Mode traffic in analytics?+
Not through client side analytics alone. AI Mode applies a noreferrer attribute to outbound links, which removes the referrer entirely. Server log analysis and Search Console give partial visibility, but GA4 cannot separate this traffic from Direct.
Is AI referral traffic better quality than organic search traffic?+
Available evidence points that way. Independent research across large retail samples found longer visits, more pages viewed and lower bounce rates from AI referrals. Small site samples show the same direction, though dwell time alone is an imperfect quality measure.
Explore with AI
Share this